Why Your Mac Is Slow and How to Diagnose It
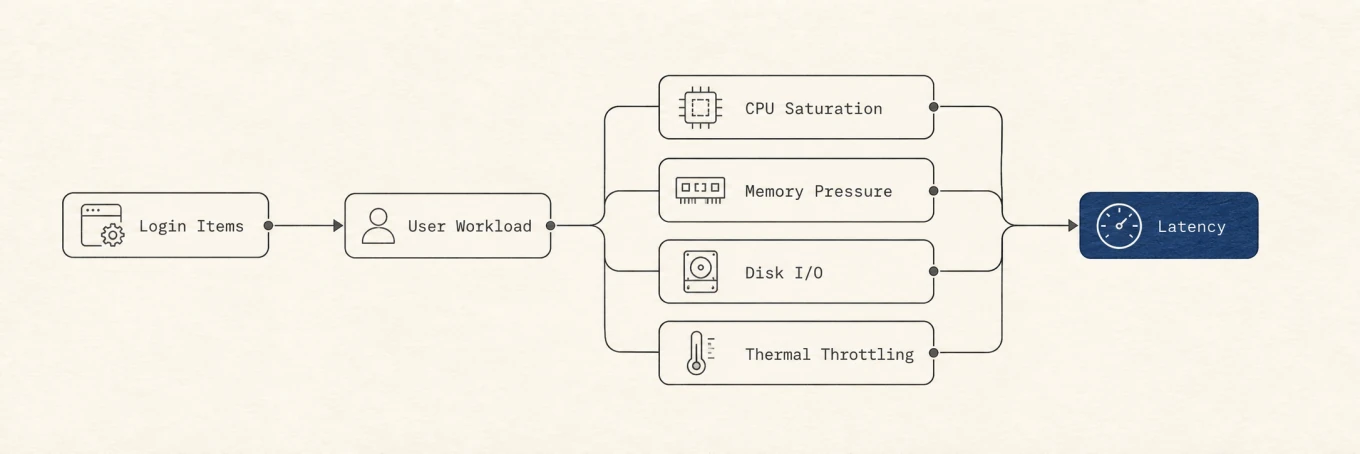
A slow Mac is a latency problem, and several bottlenecks can produce the same feeling: CPU contention, memory pressure, storage capacity, disk I/O, thermal limits, or a slow network service. The goal is to identify which resource is saturated while the slowdown is happening. A snapshot taken after the problem ends proves little.
Here is how the pieces work, and the commands to see them.
The RAM myth: free memory is not the goal
The most common wrong instinct is to look at "free memory" and panic when it is low. On macOS, low free memory is normal and healthy. Unused RAM is wasted RAM, so the kernel deliberately keeps it full: recently used files stay cached in memory so the next read is instant, and that cache is released the moment a program needs the space.
macOS also compresses memory. Since OS X Mavericks, when RAM fills, the system compresses inactive pages in place rather than immediately writing them to disk, so some data that would otherwise move to slower swap can stay in RAM. You can watch the counters directly:
vm_stat
The numbers are in pages, with the page size printed near the top. What matters is not
Pages free but memory pressure and the rate of change. Swapins and Swapouts are
cumulative since boot, so one large number does not prove a current problem. Run the
command twice during the slowdown or use Activity Monitor to see whether swap and
pressure keep rising.
The best overview is memory pressure in Activity Monitor's Memory tab. Apple's memory guide defines green as efficient use, yellow as possible pressure, and red as needing more RAM. Read that graph with the swap trend and the app list, not the free-memory figure alone.
Find the real bottleneck
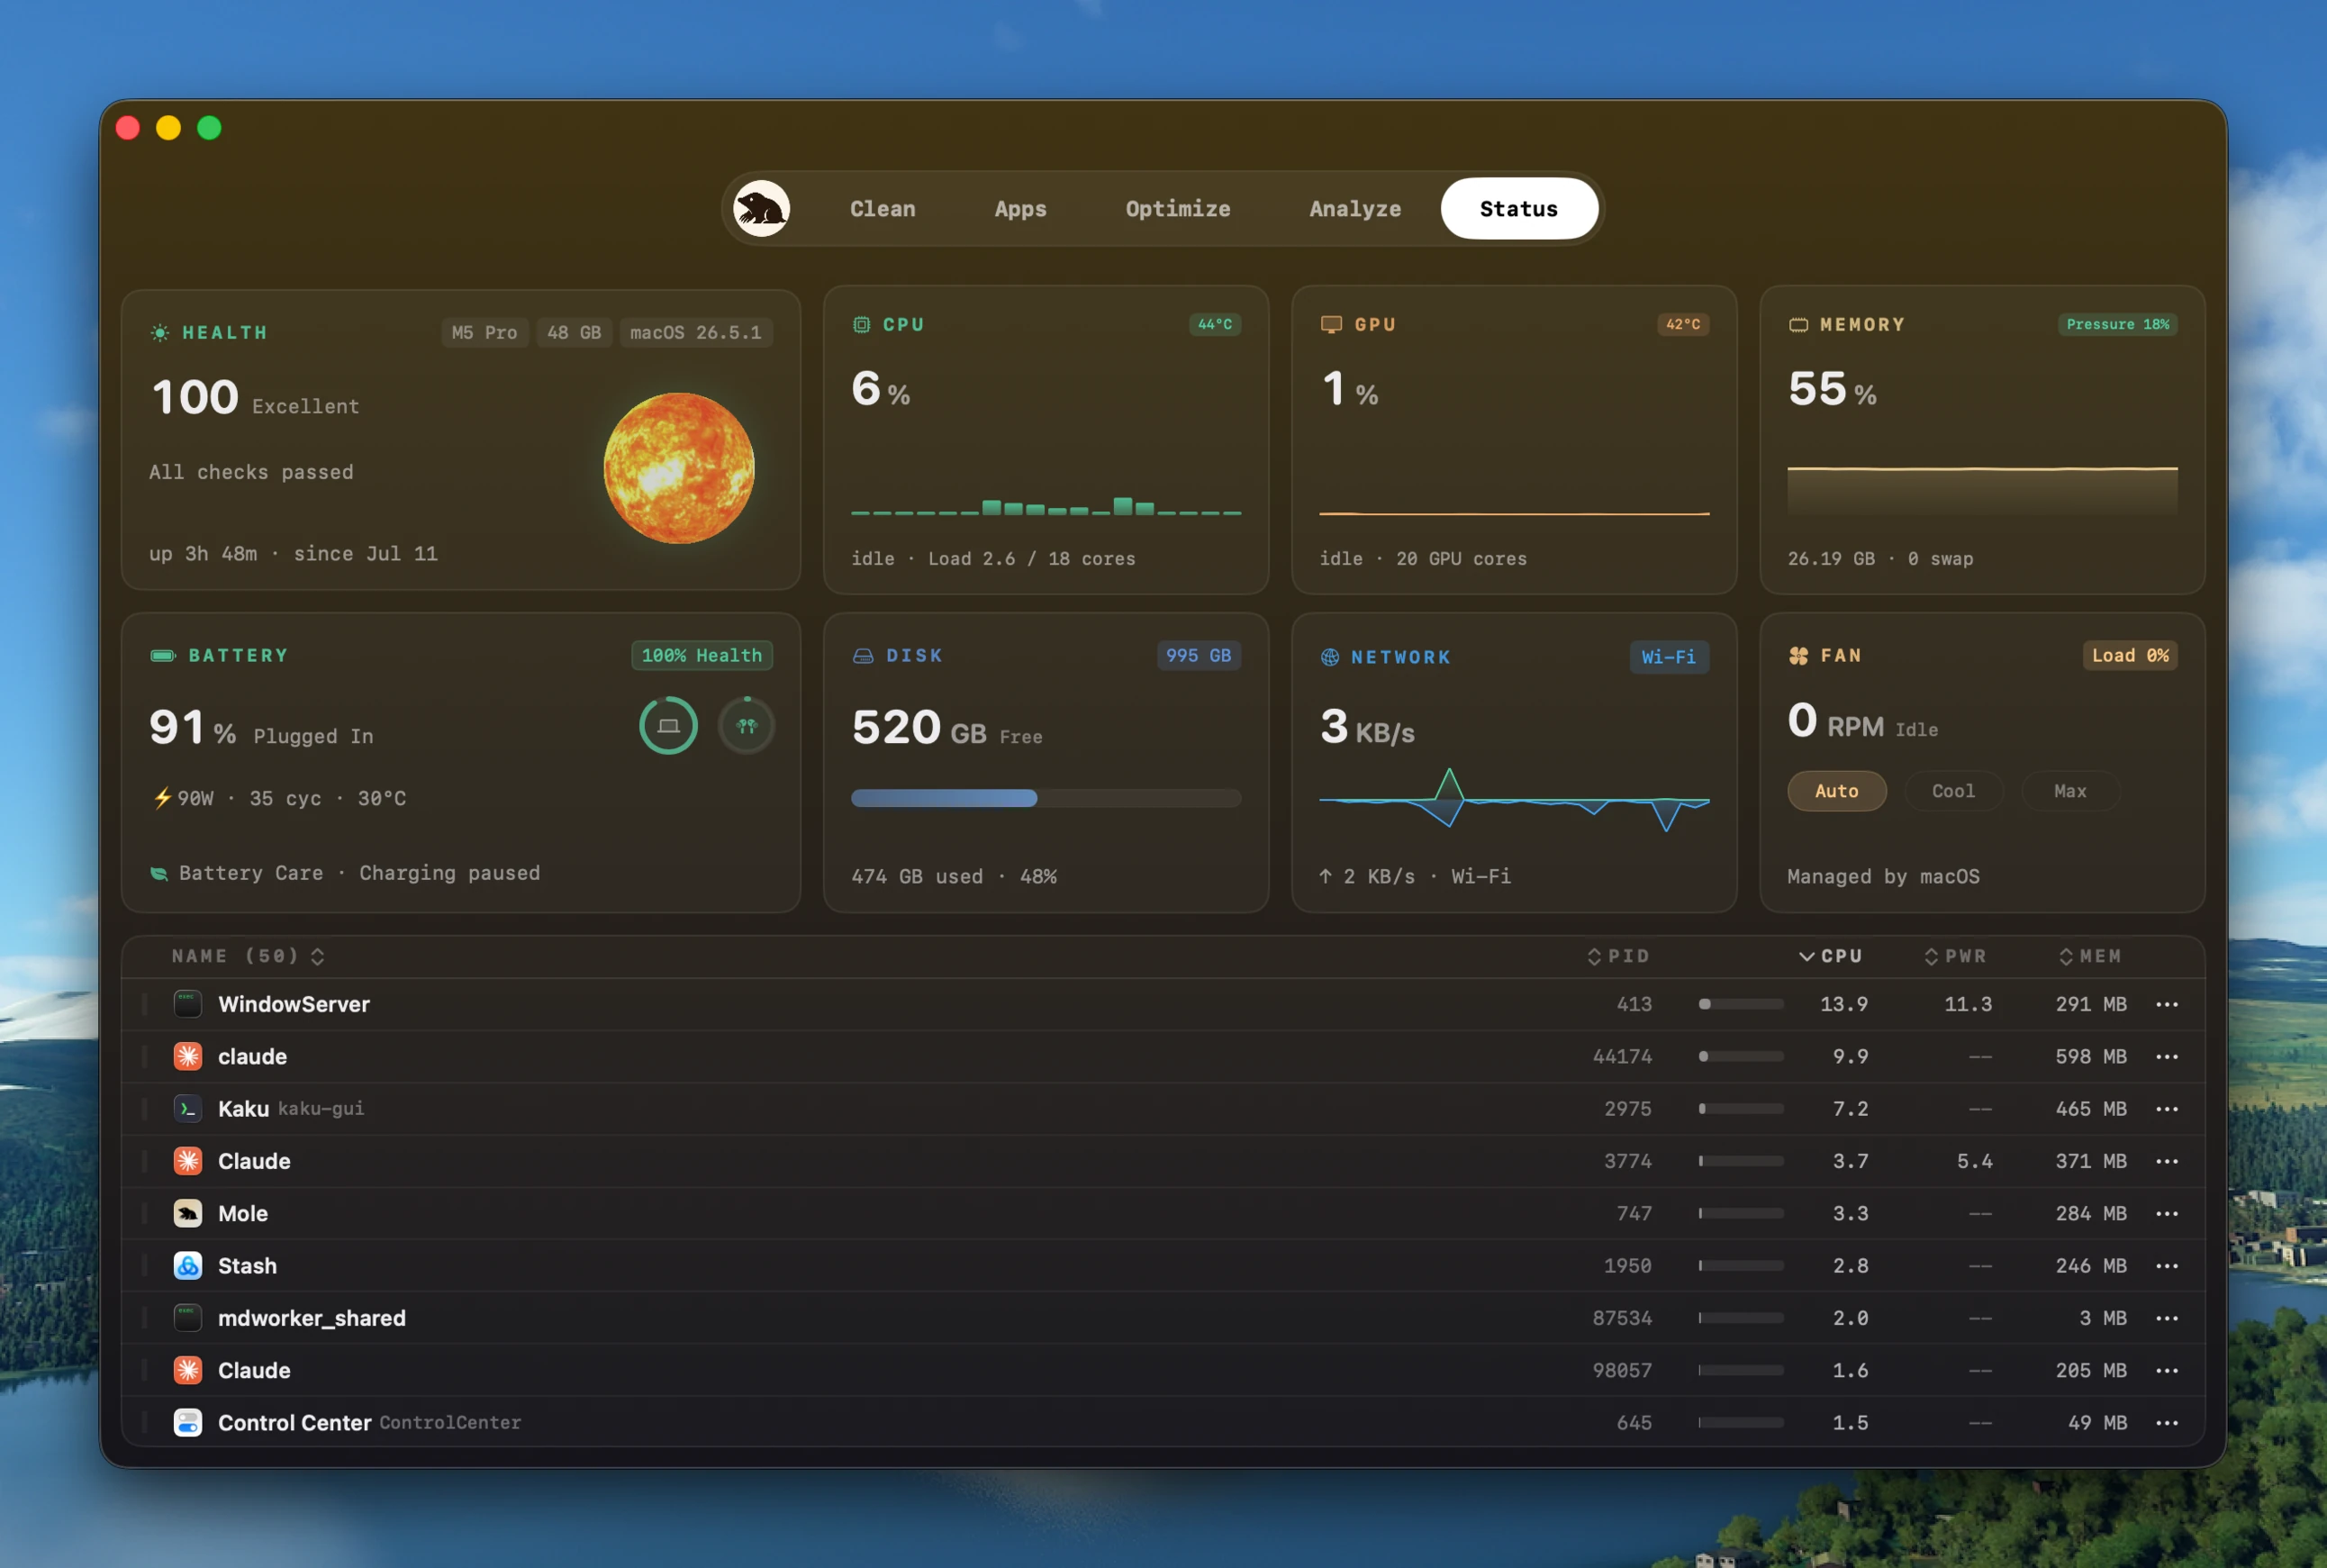
Open Activity Monitor and read its tabs in order, or use the command line:
- CPU: sort by usage with
top -o cpuin Terminal, or the Activity Monitor CPU tab. Note that %CPU is per core, so a value above 100% is one process using several cores, which is normal for a build or an export and suspicious for an idle app. - Memory: the pressure graph, as above.
- Disk capacity: run
df -h /. APFS uses free space for swap and temporary files, and a nearly full drive can block updates or leave a workload without temporary room. There is no universal safe percentage, so compare available capacity with the task that is failing. If this is your problem, find what is filling the disk and free up space. - Disk I/O: in Activity Monitor's Disk tab, sort by Bytes Written or Bytes Read and
watch the graph while the pause occurs.
iostat -w 1provides a live command-line view. A sync, backup, build, or failing external drive can cause latency even when plenty of capacity remains. - Heat: covered below.
- Network or service latency: if only one cloud-backed app is slow while local apps remain responsive, check its network activity and service status before changing the Mac. Not every slow interaction is a hardware bottleneck.
These readings separate a system-wide bottleneck from one slow app. Guessing with a generic cleanup can change several variables and hide the actual cause.
A runaway process
If the CPU is pinned, top -o cpu shows the culprit at the top. A stuck app, a
sync client re-scanning, or a background helper caught in a loop are the usual
cases. If you recognise it as safe to end, quit it. If it relaunches itself
within seconds, check for a launchd job or an app that restarts its helper (see the
startup section below). Quitting the process alone may not hold.
Be careful with system processes. kernel_task climbing is often the system
deliberately using CPU time to slow the chip down when it is hot, not a bug to
kill. That is a thermal symptom, not a memory or app one.
Thermal throttling
When a Mac runs hot, the chip lowers its clock speed to cool down, and heavy work feels sluggish. You can confirm it rather than guess:
pmset -g therm
This reports recorded thermal and performance warning state when macOS exposes it. For one detailed sample of power and thermal pressure, use:
sudo powermetrics --samplers thermal,cpu_power -n 1
Interpret trends under the same workload rather than treating one temperature as a universal limit. If throttling is the bottleneck, the fix is workload, airflow, or service, not cache cleaning. A loud fan can be supporting evidence, but fanless Macs can throttle too, and why your MacBook fan is loud covers what to do about it.
Spotlight and login items
Two background causes are worth ruling out. After a macOS update, migration, or large
file move, Spotlight may rebuild parts of its index. mdutil -s / reports whether
indexing is enabled, not whether a rebuild is currently active. Sustained mds or
mdworker CPU plus disk I/O and Spotlight's progress UI provide the context. Duration
depends on data volume, storage speed, permissions, and repeated file churn, so there
is no reliable one-hour promise.
The other is startup load. System Settings > General > Login Items & Extensions separates apps opened at login from software allowed to run in the background. Those may use Service Management, launchd, extensions, or app helpers. Disable one known item at a time and confirm the owning app still works.
Under the hood: how a monitor reads this without adding to it
You can skip this part, but it explains why the memory advice above is right, and
why a live monitor does not itself become one of your slow processes. Mole's
open-source CLI (cmd/status) and native Mac app
use separate collectors, but both split fast readings from slow enrichment.
The CLI fills the cached-memory value that its cross-platform metrics library
cannot provide on macOS by parsing file-backed pages from vm_stat and multiplying
by the reported page size. It reads the system pressure state from
memory_pressure instead of deriving it from free bytes. The native app reaches
the same answer without shelling out: it reads VM counters with host_statistics64
and the pressure level through kern.memorystatus_vm_pressure_level.
Staying light is the other half. A monitor that re-measured everything on every tick would be its own performance problem, so the collector samples in tiers:
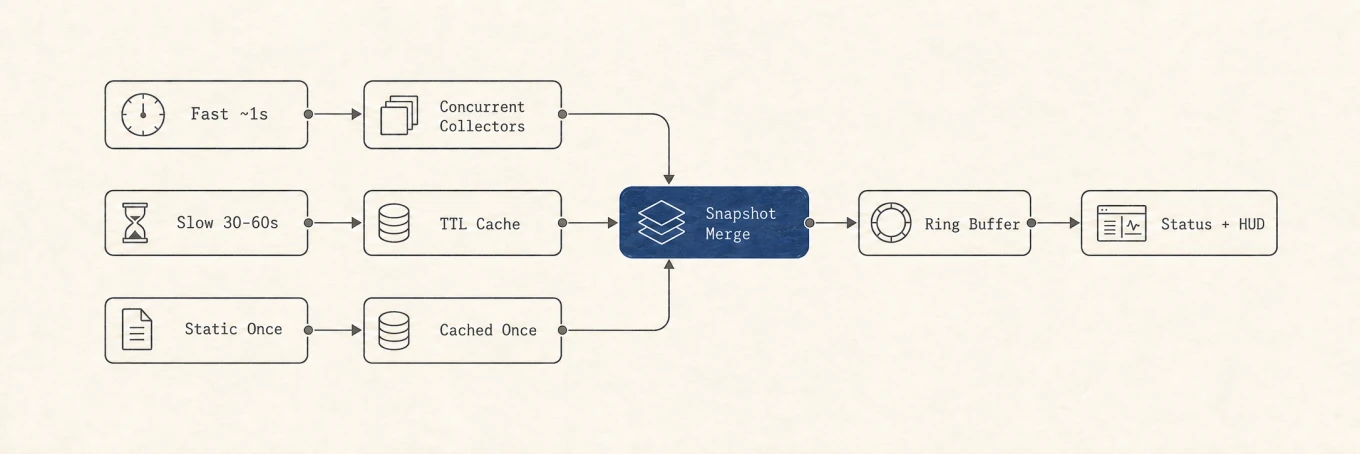
The cheap numbers (CPU, memory, and network) refresh about once a second. Process, GPU, and disk enrichment run on heavier ticks, while hardware and device probes reuse longer-lived caches. Fixed-size histories hold only the recent samples that draw the sparklines. That is how a menu bar HUD can update live without turning the monitor into the workload you are trying to diagnose.
Where a tool helps
Everything above is readable with built-in commands, which is the point: you do not need an app to diagnose a slow Mac. What an app saves you is the assembly. Mole's Status view shows CPU, memory pressure, disk, temperature, and the top processes on one screen with a live menu bar readout, and clicking a process explains what launched it, whether it is holding the Mac awake, and what it is reading and writing, which is the same launchd and I/O detail you would otherwise gather by hand. It is a convenience over the commands, not a substitute for understanding them.
Whatever you use, avoid one-click "speed up" sweeps that change unrelated state. You cannot create a durable performance gain by forcing useful file cache out of RAM. Restarting can be a useful diagnostic for a stuck process and is required by some updates, but macOS already manages memory and swap continuously.
A repeatable diagnosis
Reproduce the slowdown, watch CPU, memory pressure, disk capacity, disk I/O, thermal state, and network activity, then change one variable. Measure again under the same workload. This turns "the Mac feels slow" into a falsifiable cause and prevents a temporary restart or cleanup from being mistaken for a permanent fix.