WindowServer High CPU on Mac: Displays, Capture, Scaling

WindowServer is the macOS display compositor. Its CPU use reflects the work required to combine app surfaces across displays, but the process name does not reveal which app is causing repeated redraws. A high number during animation, screen sharing, or a display change can be normal. The useful signal is sustained load at idle plus a measurable effect on responsiveness, heat, or battery life.
What WindowServer actually is
WindowServer combines the content apps draw into the image on each display. Windows, menus, the Dock, transparency, animations, and external-display output all pass through it. Part of an app's graphical workload can therefore appear under WindowServer rather than under the app itself. A high reading does not by itself identify the source of that work, which is why killing WindowServer is the wrong first move: macOS relaunches it, everything redraws, and you still do not know which surface kept feeding it.
What drives it up
A handful of things make WindowServer work harder:
- Many windows and Spaces. Dozens of open windows and a pile of virtual desktops all have to be tracked and composited. Mission Control Spaces multiply surface count, especially when Displays have separate Spaces is on.
- External and high-resolution displays. More pixels to push, especially a 4K or 5K screen, or several monitors at once, raises the baseline steadily. Lid-closed clamshell setups still composite every connected panel.
- Scaled resolution. Running a display at a non-native "looks like" resolution can require a larger render surface and downsampling. The cost depends on the Mac, display, scaling mode, and workload; Retina scaling itself is normal.
- Transparency and motion. The blur and translucency in menus, the Dock, and Control Center are live effects WindowServer computes continuously. Heavier system UI effects on recent macOS releases can make the same scene cost more than it did on earlier versions.
- Browsers and other Electron apps. Tabs and windows with animation, video, WebGL, or lively dashboards keep submitting frames even when you are not looking at them. Chrome, Edge, Brave, Arc, Slack, Discord, VS Code, and similar apps show up often in user reports because their GPU compositing work still ends up in WindowServer.
- A window-heavy app redrawing constantly, such as a terminal printing fast, a status bar that refreshes every second, or a page animating in the background.
- Capture and remote-display software. Screen recording, video calls, AirPlay, Sidecar, Continuity Camera, remote desktop, and virtual-display tools add capture or composition work.
- High refresh rates and animated desktops. More frames or continuously changing pixels (dynamic wallpaper, Stage Manager thrash, live widgets) increase work even when you are not touching a window.
- Live resource monitors. An always-on Activity Monitor window, menu-bar CPU graphs,
or tools that force frequent UI updates can themselves keep the compositor busy. If
you also see
sysmondhigh, close the monitor briefly and recheck WindowServer.
Outdated discrete GPU drivers are a common Windows story. On Apple silicon Macs the GPU stack ships with macOS, so "update the GPU driver" is rarely the path. Prefer keeping macOS and the offending apps current instead.
When high WindowServer CPU is normal
Expect short spikes when you:
- open or resize many windows, switch Spaces, or plug in a display
- play full-screen video, run a game, or scrub a timeline
- share or record the screen
- animate a UI-heavy page in the foreground
Those bursts should fall back once the scene settles. Treat WindowServer as a problem when it stays elevated on a quiet desktop, when the cursor stutters while you type, or when fans and battery drain track the compositor with no obvious redraw source.
Diagnose it in Activity Monitor
Collect a baseline before changing settings:
- Open Activity Monitor (Applications › Utilities), choose the CPU tab, and
search for
WindowServer. - Note the percentage on a quiet desktop for one or two minutes: few visible windows, no screen share, no video, browser tabs idle or discarded.
- Reproduce the slowdown once (open the heavy browser window, start capture, or wake the external display), and watch whether WindowServer rises with that change.
- Sort by CPU and glance at browser helpers, meeting apps, screen-capture tools, and anything named like a virtual display. The top app is a suspect; WindowServer is often the bill for its drawing.
- Optional: in Terminal,
top -o cpufor thirty seconds gives the same ranking without keeping Activity Monitor's own window open.
Judge WindowServer with the symptom: smoother input, lower heat, or better battery behavior. A lower percentage with no visible or thermal improvement is not a useful fix.
How to calm it (mild to strong)
Work through the cheap wins first. Change one variable, wait, and keep the change only when both the metric and the feel improve.
- Close unused windows, tabs, and Spaces. Merge browser windows, discard idle tabs (Chrome/Edge Memory Saver or the browser's task manager), and drop Spaces you do not use. This is usually the largest cut when a browser is open.
- Reduce transparency: open System Settings › Accessibility › Display, then enable Reduce transparency. Apple's Display settings guide describes the visual change. Keep macOS updated; on some interim builds this toggle did little until a later patch. Compare the same scene before keeping it as a performance fix.
- Reduce motion: this now has its own Accessibility › Motion panel. Apple's Motion guide says it changes animations for actions such as opening apps and switching desktops.
- Pause capture and remote display. Stop screen recording, leave the meeting camera/share off, disconnect Sidecar or AirPlay, and quit virtual-display tools one at a time.
- Simplify the desktop. Switch animated or dynamic wallpaper to a still image; hide or quit live widgets and always-on HUD overlays that redraw the menu bar.
- Test display scale and refresh rate. Prefer the default "looks like" size, or a lower refresh rate on an external panel, then compare the same workload. Do not sacrifice readable text based on the assumption that all scaling is bad.
- Disconnect one display as a diagnostic. If the baseline drops, test that display's scale, refresh rate, cable, and adapter separately. On multi-monitor setups, try turning off Displays have separate Spaces under Desktop & Dock › Mission Control to cut independent compositor contexts.
- Update macOS and the heavy apps, then retest the same idle scene. Compositor and browser GPU bugs often land in ordinary point releases.
- Log out and back in only after collecting evidence; this restarts the user display session. A full restart clears leaked redraw state but can hide the app that will trigger it again, so use it after you know the pattern, not instead of isolation.
What will not help
- Do not force-quit WindowServer. Everything on screen redraws at once, CPU spikes again, and you learn nothing about the owner.
- Do not expect a generic "cleaner" or "boost" app to fix compositor load. Closing windows, cutting effects, and stopping capture are the real levers.
- Do not treat ordinary Retina scaling as a fault. Measure the scaled mode you actually use against the default on the same Mac and cable.
Under the hood: the compositor, and why scaling costs
WindowServer is a compositor. Every app draws into its own offscreen buffer, a backing store, and WindowServer combines those buffers into the final image for each display, applying transforms and effects as it goes. Compositing runs whenever the scene changes, so constant redraws and capture can cost CPU or GPU continuously. Some scaled modes use a larger intermediate surface and downsample it, but that is only one possible contributor. Pixel count, refresh rate, display count, and redraw frequency must be tested independently.
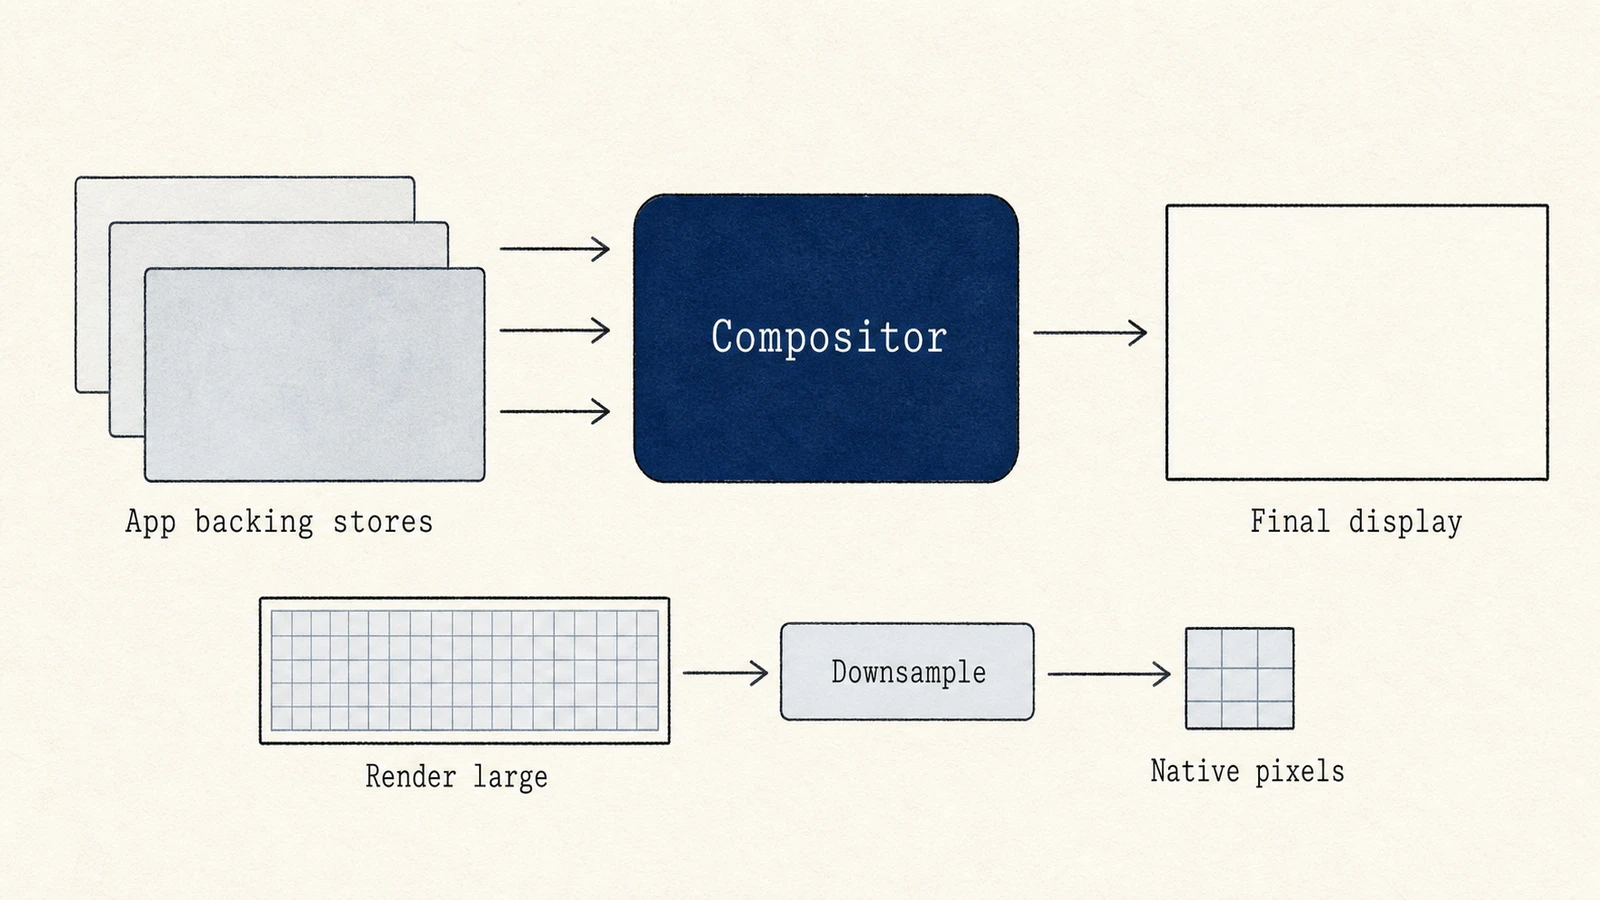
Where a monitor helps
Activity Monitor or Mole's Status view can show WindowServer, CPU, and GPU trends, but neither can automatically assign compositor cost to one app. The reliable method is controlled isolation: stop one redraw source or change one display variable, then compare the idle and workload baselines.
A repeatable diagnosis
Measure WindowServer at idle and during the problem, then isolate animated content, browsers, capture tools, displays, scale, and refresh rate one at a time. Keep the change only when both the metric and the user-visible symptom improve. Do not force-quit WindowServer or treat an ordinary Retina scale as a fault.
FAQ
Is WindowServer high CPU dangerous?
It can raise heat, fan noise, and battery drain, and it can make the UI feel sticky, but it is not malware and it will not damage the Mac by itself. Fix the redraw source; do not try to delete or disable the process.
Why is WindowServer high when Chrome looks fine?
Browser work often lands in WindowServer because the browser submits surfaces for compositing. Background tabs with animation or video can keep feeding frames even when Chrome's own helper percentages look modest. Suspend or close those tabs, then recheck.
Should I reduce transparency on Apple silicon?
Try it as a controlled test. Many M-series Macs still shed compositor work when transparency and motion drop, especially with multiple displays or browser windows. Keep the setting only if the same idle scene feels better afterward.
Does a restart permanently fix WindowServer?
A restart clears temporary redraw state and often helps for a while. If the same browser window, capture tool, or display configuration brings the load back, the configuration is the cause. Fix that, then restart only if the session is already in a bad state.