Do You Need a Mac Memory Cleaner?
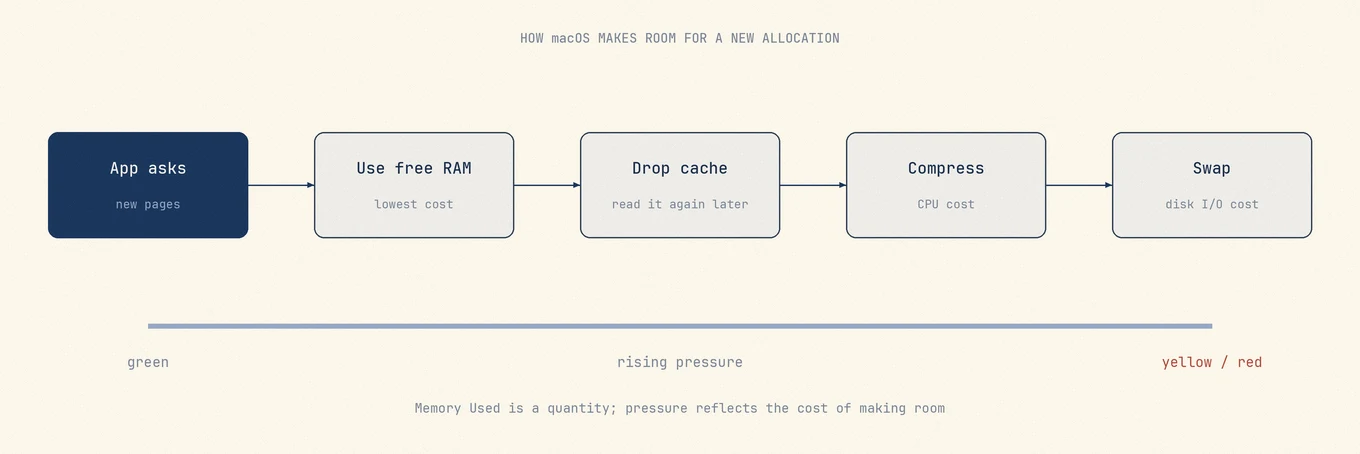
A RAM cleaner can make the free-memory number rise within seconds. That change is real, but it does not show that the Mac had a memory problem or that the next app will run faster. macOS already keeps useful data in otherwise idle memory and reclaims it when another app needs space.
The decision starts in Activity Monitor > Memory, not in a cleaner's dashboard. Green Memory Pressure means macOS is serving the current workload efficiently, even when most physical memory is occupied. Repeated yellow or red pressure, slower app switching, and swap that keeps growing together are much stronger evidence that the workload needs attention.
What the Memory pane is telling you
Apple's Activity Monitor memory guide describes Memory Pressure as a combined signal based on free memory, swap rate, wired memory, and file-cached memory. That is why one large number cannot replace the graph.
| Reading | What it represents | How to use it |
|---|---|---|
| Memory Used | App Memory, Wired Memory, and Compressed memory currently in RAM | Context, not a pass or fail score |
| Cached Files | Recently read file data kept in otherwise unused memory | Usually useful and reclaimable |
| Compressed | Less-active pages compressed to make room without going to disk | Watch whether it grows during the same workload |
| Swap Used | Memory pages moved to the startup disk | Read with pressure, responsiveness, and trend |
| Memory Pressure | How efficiently macOS can satisfy memory requests | The best first check for a current shortage |
Two Macs can both show 14 GB used on a 16 GB machine while behaving very differently. One may have several gigabytes of reclaimable file cache and stay green. The other may be compressing and paging throughout an export, with yellow pressure and long pauses. The used total hides that difference.
What a memory cleaner actually changes
Most RAM cleaners ask macOS to discard reclaimable caches or create artificial allocation pressure so the system frees them. The dashboard can then report several more gigabytes as free. The next launch, document open, or project switch has to read some of that data from storage again.
This creates a persuasive before-and-after screenshot without fixing the process that needed memory. If a browser tab, virtual machine, local model, or creative app keeps allocating, pressure will return. If pressure was green, the cleaner removed data that macOS was keeping because it could improve the next access.
A brief improvement can still happen when forcing a badly behaved app to release memory, but restarting that specific app gives a cleaner diagnostic result. It also preserves the caches used by everything else.
Test your usual workload before installing anything
- Save your work, leave the usual apps open, and wait a minute for launch and indexing activity to settle.
- Open Activity Monitor > Memory. Note the pressure colour, Swap Used, and the largest few processes.
- Reproduce the slowdown: switch projects, open the large document, start the build, or return to the tab group that causes the problem.
- Watch the graph for several minutes. A brief yellow spike that returns to green is different from pressure that stays yellow or reaches red.
- If one app grows far beyond the rest, quit it normally and reopen it. Repeat the same task once.
The last step separates an app-specific problem from a capacity problem. If pressure stays green after restarting one app, investigate that app, its tabs, extensions, plug-ins, or project. If the same required workload reliably brings yellow or red pressure back, the active set does not fit comfortably in the available memory.
Use the same workload for both observations. A screenshot taken after a restart and another taken at the end of a workday do not form a useful comparison.
Match the symptom to the real constraint
| What you see | Likely interpretation | Useful next action |
|---|---|---|
| High Memory Used, green pressure, Mac feels normal | macOS is using RAM for apps and caches | Leave it alone |
| Non-zero swap after days of uptime, green pressure | Older inactive pages have been moved out | Watch the trend, not the total |
| One app grows continuously, pressure rises | App, tab, extension, plug-in, or project may be responsible | Save work, restart the owner, then reproduce |
| Yellow or red pressure only during a required VM, model, or media job | The workload is larger than the available headroom | Reduce its allocation or concurrent workload |
| Beachballs while pressure remains green | Memory is probably not the current limit | Check CPU, thermals, storage, and network activity |
Browsers deserve one extra check because a single window can be spread across many renderer and helper processes. Add the related rows or use the browser's own task manager before concluding that an unfamiliar helper is a separate app.
Actions that help without clearing RAM
Close work you no longer need, especially suspended virtual machines, local models, and browser tabs that keep active scripts running. Reduce a VM's assigned memory only if its guest workload still fits. Update an app whose use grows across every session, and capture a repeatable case before reporting it.
A restart is useful as a controlled reset, not as proof that the Mac needs regular cleaning. If pressure returns under the same workload, the restart only cleared the history. If it does not return, add apps back gradually until the trigger is visible.
Avoid scheduled cache purges, scripts that run purge, and tools that advertise the largest possible free-memory number. They optimize a display value that macOS does not use as its health score. Also do not disable swap: it is part of the system's protection when active allocations exceed physical memory.
Where Mole fits
Mole does not include a Clean RAM button. Its Status view and menu bar place Memory Pressure beside CPU, thermal state, and the processes using the most resources. That makes it easier to distinguish a memory shortage from a hot CPU or a busy disk without discarding useful caches.
For the counters and command-line checks behind the graph, read Mac Memory Pressure explained. For a closer look at paging and SSD concerns, see what macOS Swap Memory means.
FAQ
Is it normal to have only 1 GB of free RAM?
It can be. Free memory alone is not a health score. Green Memory Pressure means macOS is still satisfying the current workload efficiently.
Does Mole clean memory?
Mole's Status view and menu bar only report memory use; they do not clear RAM. Optimize includes a memory-release task, but it runs only when macOS reports warning or critical memory pressure and is skipped at normal pressure. macOS already reclaims file caches as needed, so there is no need to clear memory routinely.
Will more memory make my Mac faster?
More memory helps when your normal workload repeatedly produces yellow or red pressure, growing swap, and visible stalls. It will not fix a CPU, thermal, storage, or network bottleneck.
Is a lower Swap Used number always better?
No. Swap includes history from the current uptime. A stable non-zero value with green pressure can be harmless; growth during yellow or red pressure is the more useful pattern.