Mac Menu Bar Status: Temperature, Fans, and Disk Space
Read menu bar values alongside what the Mac is doing. A high temperature during an export does not necessarily mean something is wrong. Low free space needs to be considered alongside reclaimable storage, and high CPU use is easier to investigate when you know which process is responsible.
Temperature, fans, memory pressure, available disk space, and processes are more useful when read together. A status monitor helps you connect changes and look for their cause.
For fan behavior under load, see Apple Silicon thermal throttling and Mac fans. For memory-specific reading, see Do you need a Mac memory cleaner?.
What each reading is for
| Signal | Useful question | Weak question |
|---|---|---|
| CPU % | Which process is active right now? | Is my Mac "at 40%" in the abstract? |
| GPU % | Is a browser, preview, or ML task driving the discrete/integrated GPU? | Should I reinstall macOS because GPU spiked once? |
| Temperature | Is this chip hot for this workload and ambient? | Is any number above 50°C a failure? |
| Fan RPM | Are fans responding to the workload, or is their speed set manually? | Can I force max fans forever for "health"? |
| Memory pressure | Is macOS struggling to satisfy allocations? | Why isn't free RAM maximized? |
| Free disk | Do I still have working headroom for swaps, updates, and exports? | Why doesn't this match Finder's categories exactly? |
| Network speed | Is the physical interface busy? | Why is a VPN tunnel's virtual counter different? |
Apple Silicon Macs add one more nuance: performance and efficiency cores have different jobs. A busy efficiency core during background indexing is not the same story as a sustained performance-core render.
Temperature: trend and workload beat the absolute number
Chips are designed to run warm under load. What matters:
- Correlation with a task. Export, compile, local model, or game on: temperatures rise. Task off: they fall. That is normal.
- Sustained throttling symptoms. Frame time stretches, compile times balloon, fans stay loud after the work should have finished.
- Sensor location. CPU proximity, GPU, and SSD sensors measure different parts of the Mac. Check which sensor you are reading before comparing it with a temperature published elsewhere.
If temperatures look alarming while the Mac is idle and has been idle for minutes, note ambient heat, whether the chassis is on a soft surface, and whether a process is still running hot in Activity Monitor. On Apple Silicon, identify the workload before following an old SMC reset procedure.
Leave fans on automatic control for daily use
On supported machines, fan curves exist to keep acoustics and thermals in a useful range. Forcing maximum fans can make a laptop unpleasant without fixing a runaway process. Forcing quiet mode during a sustained export can trade silence for throttling.
A practical approach:
- Leave automatic control on for daily work.
- Use a temporary cooler preset when you knowingly start a long render and care more about completion time than noise.
- Return to auto afterward so macOS can reclaim control.
- Investigate the process if fans stay loud with no obvious workload.
Disk space: free, purgeable, and "System Data"
Free space is not one concept:
- Truly free blocks ready for new writes.
- Purgeable space macOS can reclaim (local snapshots, disposable caches) when pressure rises.
- Category summaries in System Settings that group leftovers Apple does not itemize as apps.
Finder, System Settings, and df can show different values because of snapshots, cloned files, and delays in reclaiming space. Before buying a cleaner because System Data looks large, check available space and the large folders you recognize:
df -h /
du -sh ~/Library/Caches/* 2>/dev/null | sort -h | tail -15
Then clear only rebuildable caches whose app you can identify. Do not delete unknowns under /System.
Processes: sort, identify, then act
A status panel should make the next action obvious:
- Sort by CPU or energy.
- Identify whether the row is an app, a helper, a browser renderer, or a system service.
- Quit the relevant app or sample the process; do not force-quit
kernel_taskbased only on advice found elsewhere. - If a system process keeps a core busy after days without a restart, save your work, restart, and check whether CPU use returns to normal.
Group browser helper processes to see their total resource use. One Chrome window can create several processes.
Background cost of the monitor itself
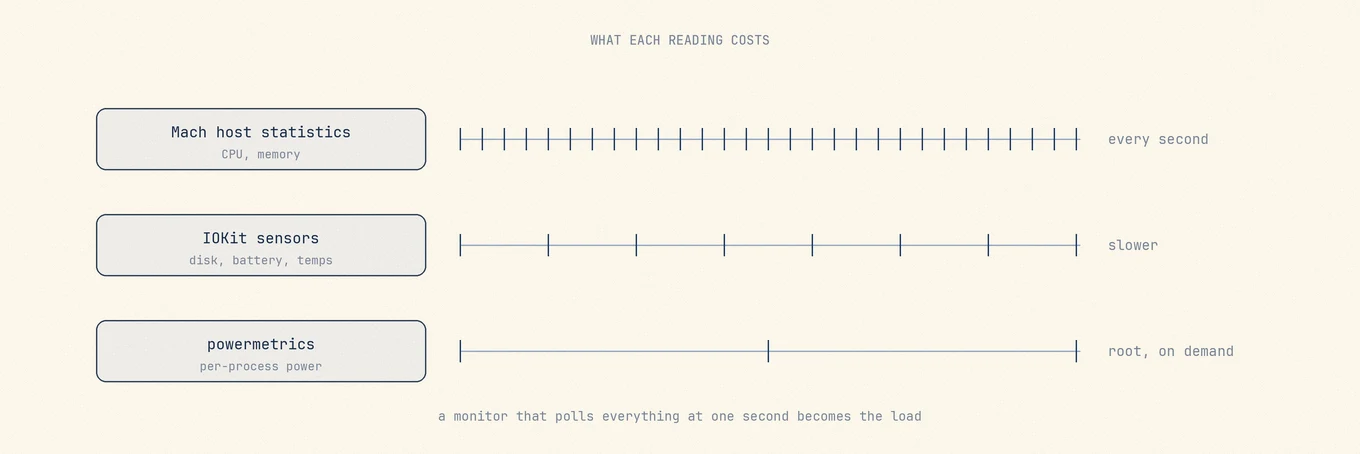
Always-on menu bar tools use some CPU, wakeups, and sometimes GPU for icon animation. Good monitors reduce refresh when another app is frontmost, release window memory shortly after you hide them, and avoid hammering disks for free-space probes. If a monitor is in your top energy consumers while idle, simplify the metrics or switch to a static icon until you need detail.
The same applies to Bluetooth battery alerts. A notification can save you from opening the panel, but frequent battery checks also use energy.
Where Mole fits
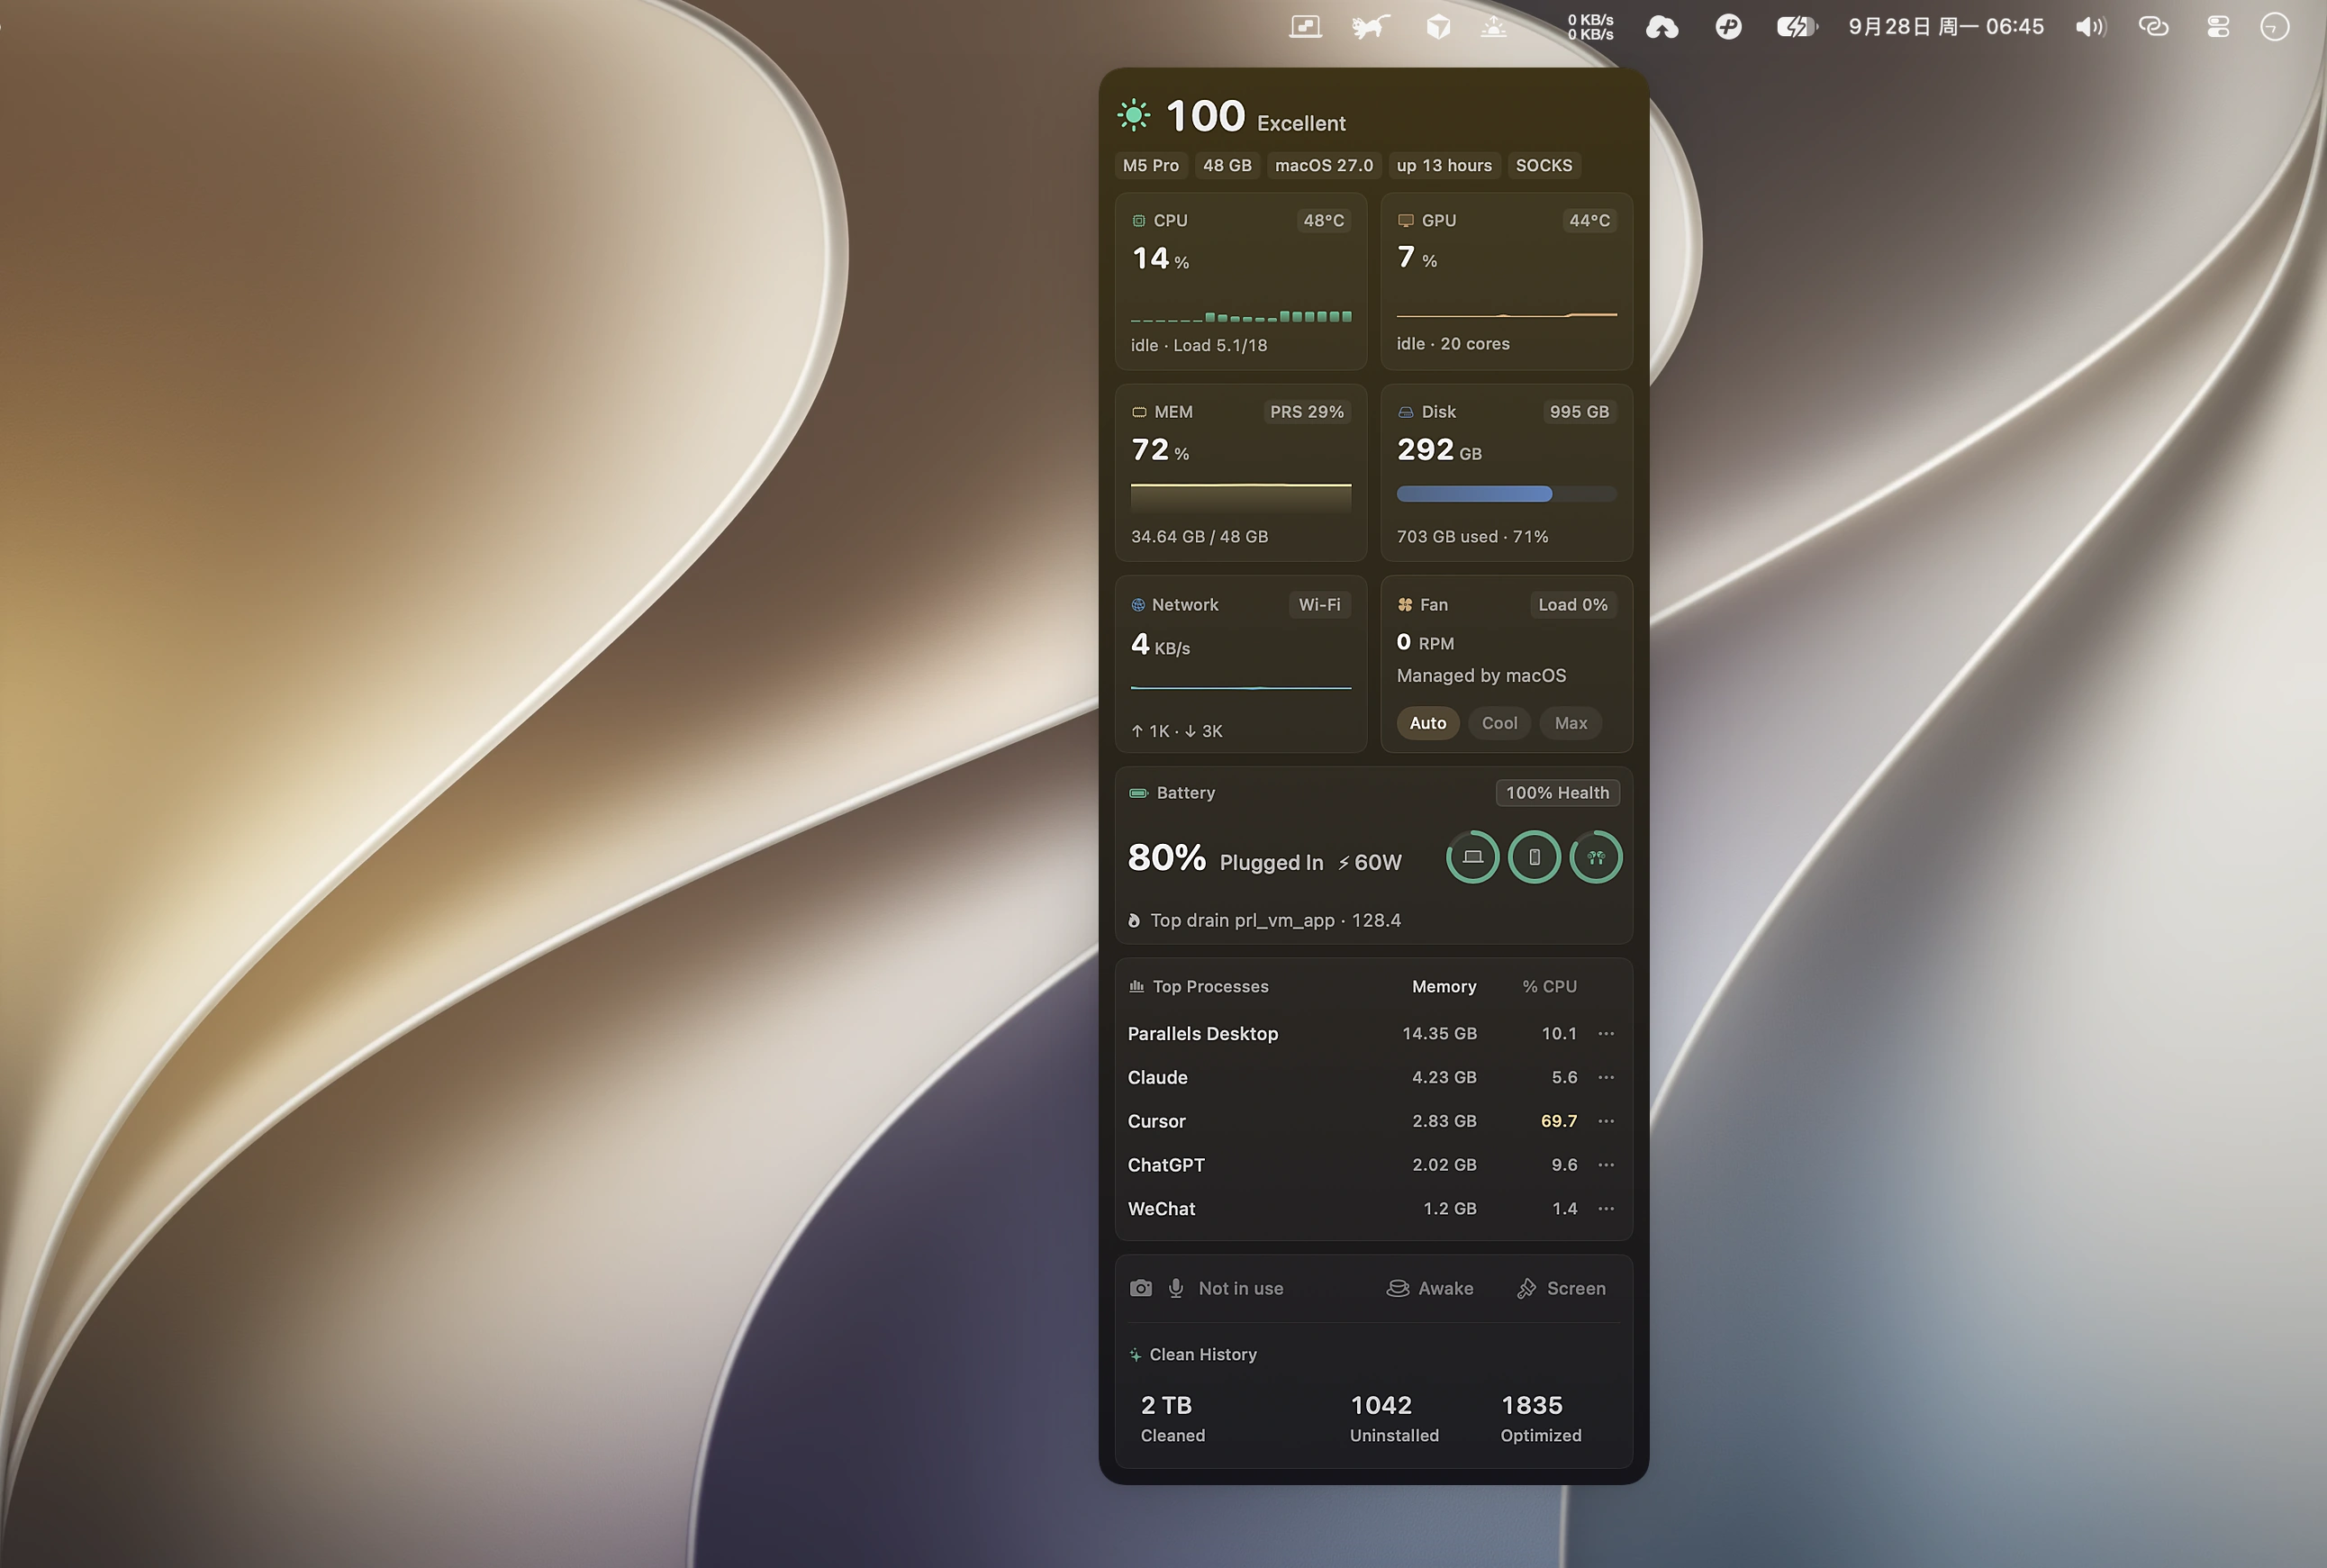
Mole brings these readings together in Status and the menu bar. Apple Silicon temperatures are steadier; menu-bar temperature and fan speed can refresh every second; free disk space is kept accurate in both Status and the menu bar. Processes can be sorted; the health score explains what it deducted; a low Bluetooth battery can alert you without opening the panel. Hidden windows release graphics memory within about a minute, and Status refreshes less while another app is in front so background use stays light.
Mole lets you monitor the Mac while cleaning or updating apps. Activity Monitor provides macOS memory and energy details. If their values differ, compare what each tool measures and when it last refreshed.
FAQ
Is a hot MacBook during export damaged?
Not by heat alone within design limits. Watch for unexpected idle heat, repeated thermal shutdowns, or throttling that persists after the workload ends.
Why doesn't free disk match System Settings?
Categories, purgeable space, snapshots, and timing differ. Compare with df and named folder measurements before deleting anything you cannot attribute.
Should I run fans at maximum all day?
No. Use automatic control daily; reserve aggressive presets for known heavy jobs, then return to auto.
Does a menu bar monitor drain battery?
Any always-on sampler has a cost. Prefer tools that idle down in the background and let you choose a static icon when you do not need animation.