Speed Up a Mac by Finding the Bottleneck
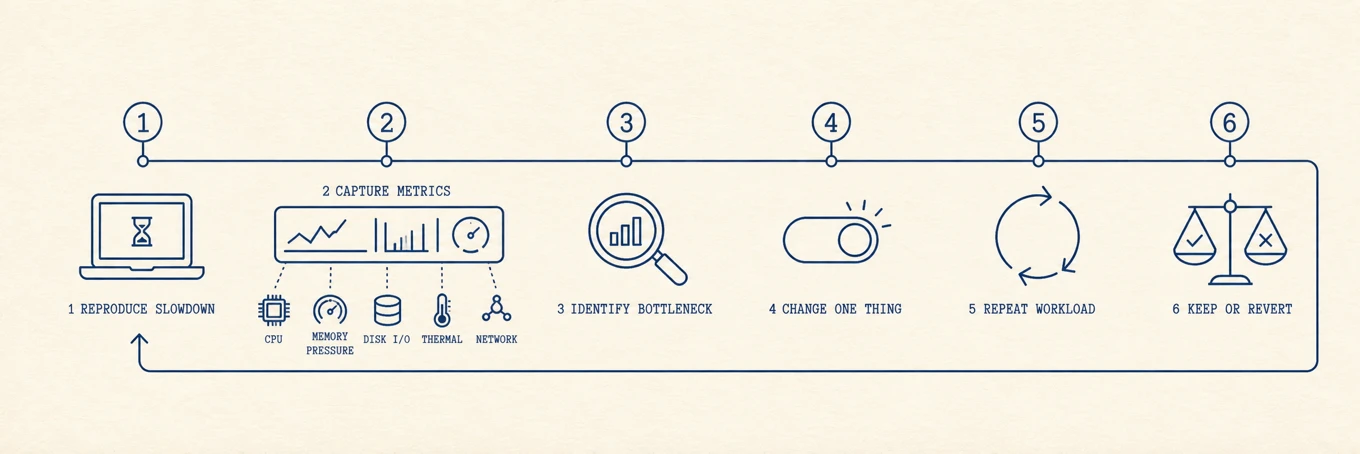
A durable speed improvement comes from removing a measured bottleneck. This checklist orders actions by information gained and recovery risk, not by how dramatic they feel. Reproduce the same slow task before and after each change, and stop when the relevant metric and the user-visible delay both improve.
Match the delay to a signal
| What feels slow | Evidence to capture before changing anything | Likely next section |
|---|---|---|
| Login takes minutes | Login Items, background items, top CPU and disk process | Cut what launches at login |
| Apps beachball while switching | Memory pressure, swap trend, disk activity | End a runaway process or review RAM needs |
| Builds or exports start fast and fade | Thermal state, fan behavior, CPU trend | Keep it cool |
| Saving or updating fails | Available storage and the task's temporary-space need | Give the disk room |
| One website or call stalls | Browser task manager and live network throughput | Tame the browser or inspect the network |
Choose the row that matches the delay. Running every section turns a diagnosis into a pile of changes whose effect cannot be measured.
1. Capture evidence, then restart if useful
While the Mac is slow, open Activity Monitor and note the top CPU process, memory pressure, swap trend, and disk activity. Apple's memory guide explains why memory pressure and swap are more useful than the amount of free RAM. Then restart if an update requires it or you suspect a stuck process. If the same workload is fast immediately afterward but slows again later, that is a clue to a time-dependent workload or possible leak, not proof of the cause or a permanent fix. macOS does not need routine restarts to "clear RAM."
2. Give the disk room
APFS uses available capacity for swap and temporary files, so a nearly full drive can slow many operations at once and block updates. There is no universal safe percentage; large builds, media exports, virtual machines, and OS updates need different headroom. If capacity is tight, find what is filling the disk and clear the safe categories, covered in how to free up space and how to find large files. Treat capacity as the bottleneck only when it is actually low or the failing task needs more temporary room.
3. Cut what launches at login
Everything that opens at login competes for the CPU right after boot and some of it keeps running all day. Trim the list in System Settings, both the visible apps and the background helpers, as described in managing startup programs. Fewer things starting means a faster login and more headroom afterward.
4. End a runaway process
If the Mac is slow right now, a process may be pinning the CPU or disk. Open Activity Monitor, sort the CPU tab by usage, and look at the top line. A stuck app or a sync client re-scanning can hold a core or saturate storage. Sample it or inspect open files when the cause is unclear. Activity Monitor's Sample Process captures a short report without terminating the process. Quit it if you recognize it as safe. If it relaunches within seconds, check whether a login item, service policy, or another app restarted it; step 3 covers the login-item case.
5. Update macOS
Point releases can carry performance and stability fixes. Back up first, read known compatibility notes for critical software, then use System Settings > General > Software Update. Update the specific app involved too. An update is an experiment with a changelog and rollback cost, not a universal speed button.
6. Tame the browser
A browser often has many processes, but tab count alone is not proof. Use the browser's own task manager to find the tab or extension consuming CPU or memory, then suspend, reload, or remove that exact item. Clearing browser cache mainly affects disk and network behavior; it is not the normal fix for memory pressure.
7. Clear the big caches
Caches speed apps up and many enforce their own limits, but a stale or poorly bounded cache can become large. Clear a measured, documented cache when low capacity or a corrupt index is the problem. Rebuilding caches can make the next launch slower and increase network use, so this step should follow evidence.
8. Keep it cool
When a Mac runs hot it throttles its own chip to cool down, and heavy work feels sluggish. A loud fan and warm case are reasons to check thermal state, not proof that heat is the bottleneck. The guide to why a MacBook fan runs loud covers airflow and what to check.
Where an integrated view helps
The built-in tools are sufficient, but their evidence is scattered across Activity Monitor, Storage, Login Items, and app-specific controls. Mole places comparable CPU, memory-pressure, disk, startup, and thermal views together. The value is faster attribution; cleanup should still be a separate, reviewed decision.
Verify the change
Run the original slow task again and compare duration, CPU, memory pressure, disk I/O, and thermal state. If only the feeling changed, keep investigating. If one metric and the task both improved, document the change and stop. Avoid stacking multiple tweaks, because you lose the ability to explain or reverse the result.